To build a Research Object, ACTION has developed and applied a methodology based on two stages:
1) In the first stage, we need to identify the resources and the relations between the elements that compose each research object. To start characterizing each research object a graphical notation was adopted to represent the resources in the RO and the relations among them. A graphical annotation to represent ROs helps in visualizing them and it is useful for people not familiar with these concepts. Figure 1 depicts this notation.
2) In the second stage, we need to create and deploy the research objects on a platform where they can be shared and cited.
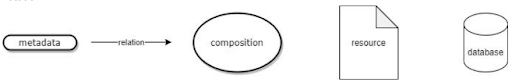
Figure 1. Graphical notation
In this post, we are going to apply this methodology to one of our pilots.
NOISE MAPS allows citizens to generate and to analyse urban sound data, empowering communities to take action to reduce unwanted noise and protect the local sonic heritage.
The pilot builds on existing cultural practices of collective documentation of the sound heritage of neighbourhoods (Mapa Sonor). Thanks to the project activities citizens will be able to filter unwanted noise out from authentic, locally unique sounds, thus allowing communities to take action to preserve their sonic heritage.
For this pilot, the data source is a collection of sounds recorded with a special device whose description and firmware can be found in the links shown in the diagram. Only some of these sounds are uploaded to the sounds platform Freesound. This is because these sounds can contain personal conversations so a curation process is needed.
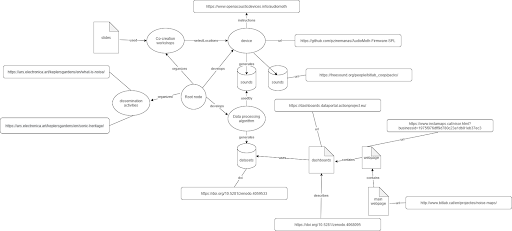
Figure 2. Noise Maps diagram
All sounds recorded are processed with an algorithm to detect the sources of the sounds such as kids playing, traffic, schools, etc … The result of this algorithm is a dataset that has been deposited in Zenodo, generating the corresponding DOI. Also, this dataset was uploaded to the ACTION database allowing its visualization through the Grafana platform.
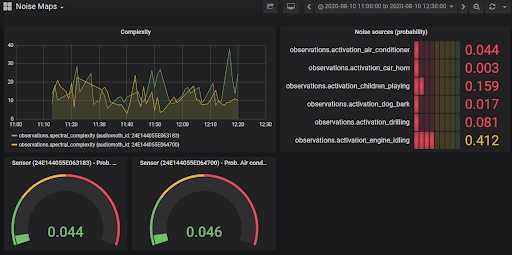
Figure 3. Grafana dashboards
Moreover, these dashboards were embedded in a geographical platform of the Catalonia Geographical Institute. Both links are shown in the diagram.
You can see the full diagram here: https://drive.google.com/file/d/1S1htElFPdr_F8MpH2tfSvIg9xeeWtUpG/view?usp=sharing
And the research object here: http://www.rohub.org/rodetails/noisemaps/overview
Do you want to do the same? Call ACTION!